MEGA Sector Rotation CRYPTOCAP - 7 Narrativas 5m### MEGA Sector Rotation CRYPTOCAP - 7 Narratives
**Description for publishing on TradingView:**
This advanced indicator lets you visualize in real time the **rotation of narratives** within the crypto market through 7 key sectors, normalized for perfect side-by-side comparison.
Each line represents the **historical relative strength** (min-max normalization over 5000 bars) of a specific narrative, based on TradingView's official aggregated market caps (CRYPTOCAP) and custom sums. The lines oscillate between 0 and 100, with clear crossovers signaling when a sector is gaining or losing momentum relative to the others.
**The 7 narratives included:**
1. **Layer1** (pink) – Aggregated market cap of major Layer 1 blockchains.
2. **Memecoins** (bright green) – Official MEME.C sector (PEPE, SHIB, WIF, BONK, etc.).
3. **AI** (orange) – Artificial Intelligence and Big Data narrative.
4. **Exchanges** (purple) – Exchange tokens (centralized and decentralized).
5. **DeFi Total** (cyan) – Full aggregated market cap of the DeFi ecosystem.
6. **RWA Custom** (brown) – Custom sum of Real World Assets: ONDO + LINK + CFG + SYRUP.
7. **Privacy** (dark orange) – Custom sum of privacy coins: XMR + ZEC + DASH.
**Quick interpretation:**
- Line >80 and rising → Narrative is **HOT** (strong bullish rotation).
- Line <20 → Narrative is **COLD** (losing strength).
- Bullish crossovers → Money rotating into that sector.
- Transparent fills between lines to highlight leadership zones.
**Features:**
- Optimized for **lower timeframes** (5m, 15m, 1H, 4H) → ideal for day trading and scalping narratives.
- Works on any TF thanks to 5-minute resolution data.
- Thick lines, vibrant colors, and horizontal references (20/50/80) for instant reading.
Perfect for spotting early which narrative is attracting capital flows and anticipating sector moves in the crypto market.
Add this indicator and trade rotations like a pro!
#crypto #sectorrotation #narratives #altcoins #tradingview
Buscar en scripts para "relative strength"

Multi-indicator Signal Builder [Skyrexio]Overview
Multi-Indicator Signal Builder is a versatile, all-in-one script designed to streamline your trading workflow by combining multiple popular technical indicators under a single roof.
It features a single-entry, single-exit logic, intrabar stop-loss/take-profit handling, an optional time filter, a visually accessible condition table, and a built-in statistics label.
Traders can choose any combination of 12+ indicators (RSI, Ultimate Oscillator, Bollinger %B, Moving Averages, ADX, Stochastic, MACD, PSAR, MFI, CCI, Heikin Ashi, and a “TV Screener” placeholder) to form entry or exit conditions.
This script aims to simplify strategy creation and analysis , making it a powerful toolkit for technical traders.
Indicators Overview
RSI (Relative Strength Index)
Measures recent price changes to evaluate overbought or oversold conditions on a 0–100 scale.
Ultimate Oscillator (UO)
Uses weighted averages of three different timeframes, aiming to confirm price momentum while avoiding false divergences.
Bollinger %B
Expresses price relative to Bollinger Bands, indicating whether price is near the upper band (overbought) or lower band (oversold).
Moving Average (MA)
Smooths price data over a specified period. The script supports both SMA and EMA to help identify trend direction and potential crossovers.
ADX (Average Directional Index)
Gauges the strength of a trend (0–100). Higher ADX signals stronger momentum, while lower ADX indicates a weaker trend.
Stochastic
Compares a closing price to a price range over a given period to identify momentum shifts and potential reversals.
MACD (Moving Average Convergence/Divergence)
Tracks the difference between two EMAs plus a signal line, commonly used to spot momentum flips through crossovers.
PSAR (Parabolic SAR)
Plots a trailing stop-and-reverse dot that moves with the trend. Often used to signal potential reversals when price crosses PSAR.
MFI (Money Flow Index)
Similar to RSI but incorporates volume data. A reading above 80 can suggest overbought conditions, while below 20 may indicate oversold.
CCI (Commodity Channel Index)
Identifies cyclical trends or overbought/oversold levels by comparing current price to an average price over a set timeframe.
Heikin Ashi
A type of candlestick charting that filters out market noise. The script uses a streak-based approach (multiple consecutive bullish or bearish bars) to gauge mini-trends.
TV Screener
A placeholder condition designed to integrate external buy/sell logic (like a TradingView “Buy” or “Sell” rating). Users can override or reference external signals if desired.
Unique Features
Multi-Indicator Entry and Exit
You can selectively enable any subset of 12+ classic indicators, each with customizable parameters and conditions. A position opens only if all enabled entry conditions are met, and it closes only when all enabled exit conditions are satisfied, helping reduce false triggers.
Single-Entry / Single-Exit with Intrabar SL/TP
The script supports a single position at a time. Once a position is open, it monitors intrabar to see if the price hits your stop-loss or take-profit levels before the bar closes, making results more realistic for fast-moving markets.
Time Window Filter
Users may specify a start/end date range during which trades are allowed, making it convenient to focus on specific market cycles for backtesting or live trading.
Condition Table and Statistics
A table at the bottom of the chart lists all active entry/exit indicators. Upon each closed trade, an integrated statistics label displays net profit, total trades, win/loss count, average and median PnL, etc.
Seamless Alerts and Automation
• Configure alerts in TradingView using “Any alert() function call.”
• The script sends JSON alert messages you can route to your own webhook.
• The indicator can be integrated with Skyrexio alert bots to automate execution on major cryptocurrency exchanges.
Optional MA/PSAR Plots
For added visual clarity, optionally plot the chosen moving averages or PSAR on the chart to confirm signals without stacking multiple indicators.
Methodology
Multi-Indicator Entry Logic
When multiple entry indicators are enabled (e.g., RSI + Stochastic + MACD), the script requires all signals to align before generating an entry. Each indicator can be set for crossovers, crossunders, thresholds (above/below), etc. This “AND” logic aims to filter out low-confidence triggers.
Single-Entry Intrabar SL/TP
• One Position At a Time: Once an entry signal triggers, a trade opens at the bar’s close.
• Intrabar Checks: Stop-loss and take-profit levels (if enabled) are monitored on every tick. If either is reached, the position closes immediately, without waiting for the bar to end.
Exit Logic
All Conditions Must Agree: If the trade is still open (SL/TP not triggered), then all enabled exit indicators must confirm a closure before the script exits on the bar’s close.
Time Filter
Optional Trading Window: You can activate a date/time range to constrain entries and exits strictly to that interval.
Justification of Methodology
Indicator Confluence: Combining multiple tools (RSI, MACD, etc.) can reduce noise and false signals.
Intrabar SL/TP: Capturing real-time spikes or dips provides a more precise reflection of typical live trading scenarios.
Single-Entry Model: Straightforward for both manual and automated tracking (especially important in bridging to bots).
Custom Date Range: Helps refine backtesting for specific market conditions or to avoid known irregular data periods.
How to Use
Add the Script to Your Chart
• In TradingView, open Indicators , search for “Multi-indicator Signal Builder” .
• Click to add it to your chart.
Configure Inputs
• Time Filter: Set a start and end date for trades.
• Alerts Messages: Input any JSON or text payload needed by your external service or bot.
• Entry Conditions: Enable and configure any indicators (e.g., RSI, MACD) for a confluence-based entry.
• Close Conditions: Enable exit indicators, along with optional SL (negative %) and TP (positive %) levels.
Set Up Alerts
• In TradingView, select “Create Alert” → Condition = “Any alert() function call” → choose this script.
• Entry Alert: Triggers on the script’s entry signal.
• Close Alert: Triggers on the script’s close signal (or if SL/TP is hit).
• Skyrexio Alert Bots: You can route these alerts via webhook to Skyrexio alert bots to automate order execution on major crypto exchanges (or any other supported broker).
Visual Reference
• A condition table at the bottom summarizes active signals.
• Statistics Label updates automatically as trades are closed, showing PnL stats and distribution metrics.
Backtesting Guidelines
Symbol/Timeframe: Works on multiple assets and timeframes; always do thorough testing.
Realistic Costs: Adjust commissions and potential slippage to match typical exchange conditions.
Risk Management: If using the built-in stop-loss/take-profit, set percentages that reflect your personal risk tolerance.
Longer Test Horizons: Verify performance across diverse market cycles to gauge reliability.
Example of statistic calculation
Test Period: 2023-01-01 to 2025-12-31
Initial Capital: $1,000
Commission: 0.1%, Slippage ~5 ticks
Trade Count: 680 (varies by strategy conditions)
Win rate: 75.44% (varies by strategy conditions)
Net Profit: +90.14% (varies by strategy conditions)
Disclaimer
This indicator is provided strictly for informational and educational purposes.
It does not constitute financial or trading advice.
Past performance never guarantees future results.
Always test thoroughly in demo environments before using real capital.
Enjoy exploring the Multi-Indicator Signal Builder! Experiment with different indicator combinations and adjust parameters to align with your trading preferences, whether you trade manually or link your alerts to external automation services. Happy trading and stay safe!

VaRz BTC/Gold Risk MeterVaRz Risk Meter (BTC vs Risk-On & Gold Safe-Haven Proxy)
The VaRz Risk Meter is a macro sentiment oscillator designed to measure Bitcoin’s relative strength and directional bias using key risk-appetite and safe-haven flows.
Indicator Components
VIX → Market fear & volatility benchmark
NASDAQ 100 (NDX) → Primary risk-on proxy (growth/tech capital flow)
Gold (XAUUSD) → Safe-haven strength alternative to USD index
Bitcoin (BTCUSDT) → Used only for normalization reference, not bias calculation
Core Logic
All assets are normalized on a 0–100 scale using a 100-period rolling window to create a balanced comparison across markets.
The Bitcoin Macro Bias Histogram is calculated as:
NASDAQ strength − VIX fear − Gold safe-haven strength
This produces a macro directional regime for Bitcoin:
Market Regimes Interpretation
Indicator State Meaning for BTC
NASDAQ high + VIX low + Gold weak Risk-On environment → Bullish for Bitcoin
Gold strong + VIX rising + NASDAQ weak Risk-Off / flight to safety → Bearish pressure on BTC
All assets near 50 with no trend Neutral / Sideways → Macro indecision
How to Use
This is not a direct entry signal, but a macro bias filter
Best combined with:
Market Structure, Liquidity zones, Orderflow, Volume analysis, and Elliott Wave context
Bias becomes more reliable on higher timeframes (1W, 1M) but works on any chart
Key Insight
Bitcoin behaves as a hybrid risk asset. This indicator helps track when capital is:
Rotating into risk markets (favorable for BTC)
or
Seeking protection in gold and volatility hedges (unfavorable for BTC)
The histogram visually maps these shifts to give traders a clear macro regime awareness in one window.

Bull/Bear vs Base vs Index (% Change Spread)Visualizes the performance gap ("Beta Decay") between 3x Leveraged ETFs (SOXL/SOXS) and their underlying sector (SOXX), relative to the S&P 500 (SPY).
This indicator is designed for traders who trade leveraged products (like SOXL/SOXS, TQQQ/SQQQ) and need to see true relative strength beyond simple price action.
It calculates the percentage change over a user-defined lookback period for four instruments:
Base (1x): The sector benchmark (Default: SOXX).
Bull (3x): The leveraged long ETF (Default: SOXL).
Bear (-3x): The leveraged inverse ETF (Default: SOXS).
Index: The broad market zero-line (Default: SPY).
It then plots the Spread to reveal the health of the trend:
Bull Spread (Green Line): Bull % - Base %
Bear Spread (Red Line): Bear % - Base %
Base vs Index (Filled Area): Base % - SPY %
🧠 The Logic: Why Use Spreads?
In a perfectly efficient trending market, a 3x Bull ETF should move exactly 300% of the underlying asset. However, in choppy or volatile markets, volatility decay (beta slippage) causes leveraged ETFs to underperform mathematically.
Positive Spread: The leveraged ETF is successfully capturing momentum (The "Sweet Spot").
Negative Spread: The leveraged ETF is suffering from drag or the underlying asset is chopping.
📈 Recommended Trading Plan
Note: This indicator works best as a filter for entry conditions, not a standalone signal. Always use proper risk management.
Strategy A: The "Clean Trend" (Momentum)
Goal: Enter a 3x position only when volatility drag is minimal.
1. Bull Signal:
Condition 1: The Base vs Index (Area) is Green (Sector is outperforming SPY).
Condition 2: The Bull Spread (Green Line) is Positive (> 0).
Why: This confirms the sector is strong AND the 3x ETF is amplifying that move efficiently without decay eating the profits.
2. Bear Signal:
Condition 1: The Base vs Index (Area) is Red (Sector is lagging SPY).
Condition 2: The Bear Spread (Red Line) is Positive (> 0).
Why: This confirms the sector is crashing and the Bear ETF is successfully capturing the downside momentum.
Strategy B: The "Decay Avoidance" (Cash is King)
Goal: Avoid leveraged funds during chop.
Condition: If BOTH the Bull Spread and Bear Spread are Negative (< 0) (below the zero line).
Action: Stay in Cash or trade the 1x underlying (SOXX) only.
Why: When both spreads are negative, it mathematically proves that the market is too choppy for leverage. Both the Long and Short leveraged funds are losing value relative to the underlying asset.
Features:
Pine Script® v6: Updated for the latest engine performance and visuals.
Dashboard Table: Real-time percentage spreads displayed directly on the chart (customizable position).
Fully Customizable: Works on any sector (e.g., set inputs to QQQ/TQQQ/SQQQ for Tech).
Disclaimer:
Trading leveraged ETFs involves significant risk. This script is for educational purposes only.

GC1 Orderflow Engine - sudoTLDR
This indicator measures relative buying and selling pressure by comparing GC1! futures returns against XAU price returns, normalized by their own volatility and weighted by GC1! volume. The result is a pressure histogram and line that show whether futures orderflow is leading, lagging, or diverging from spot gold in real time.
What this indicator does
The Orderflow Engine is designed to answer one core question:
Is GC1! futures orderflow applying net pressure in the same direction as XAU, or pushing against it?
It does this by isolating relative strength and weakness between futures and spot, rather than looking at price direction alone.
How the pressure calculation works
1. GC1! futures returns and XAU returns are calculated bar by bar
2. Each return is normalized by its own recent volatility
3. The normalized XAU return is subtracted from the normalized GC1! return
This creates a relative pressure value:
Positive pressure - GC1! futures are outperforming XAU
Negative pressure - GC1! futures are underperforming XAU
Near zero - futures and spot are moving in balance
To emphasize meaningful activity:
GC1! volume is converted into a normalized score
Higher-than-normal futures volume increases the weight of the pressure
Low-volume pressure is naturally dampened
The final output is clamped to keep the scale stable across different market conditions.
Visual output
Histogram
Green bars - positive futures pressure
Red bars - negative futures pressure
Gray bars - neutral or minimal pressure
Pressure line
A smoother view of the same pressure data
Useful for spotting momentum shifts and divergence
Zero line
Represents balance between futures and spot
Crosses often mark changes in orderflow control
Optional annotations
Regime shift markers based on futures participation
Optional percent-change labels for studying pressure acceleration
How to use it
-Confirm whether price moves are supported by futures orderflow
-Spot early divergence between GC1! and XAU
-Identify absorption , distribution , or initiative behavior
-Filter entries by trading only when pressure aligns with your bias
-This tool is best used as confirmation and context, not as a standalone signal generator.
Design philosophy
-Self-normalizing across sessions and volatility regimes
-No fixed thresholds that break over time
-Focused on relative behavior, not prediction
-Built to pair naturally with the Participation Regime indicator

RSI For Loop | PWRSI For Loop – True Dominance Oscillator
RSI For Loop – True Momentum Dominance Through Historical Comparison
The Relative Strength Index (RSI) is excellent at measuring recent price change intensity, but a reading of 70 or 30 has completely different implications depending on the market regime. RSI For Loop removes this ambiguity by transforming RSI into a clean, zero-centered dominance / percentile-rank oscillator that always tells you exactly how strong or weak the current momentum is compared to recent history.
How it works
- Standard RSI is calculated normally (default length 46).
- A simple for-loop compares the current RSI value against the actual RSI value of every previous bar inside the user-defined lookback window (default 1 to 99 bars ≈ one full quarter on daily charts).
- Current RSI higher → +1 point
- Current RSI lower → –1 point
The resulting score ranges from –99 to +99 and is naturally centered around zero:
1. +40 = current momentum beats ~70 % of the last 99 bars (approximation)
2. –60 = current momentum is weaker than ~80 % of the last 99 bars (approximation)
3. Near zero = balanced or ranging market
Additional statistical layers
- A very long rolling median of the score (default 240 periods) serves as a slow, robust dynamic centerline
- Upper and lower 3σ bands are calculated from the standard deviation of the underlying RSI median (default length 60) to highlight truly rare extreme-dominance phases
- Asymmetric trend thresholds (default Long +15 / Short –28) reflect the empirical observation that downside momentum is usually sharper and faster
Origin and development
The core idea of using a for-loop on RSI was originally introduced by @viResearch in his invite-only “RSI For Loop” script.
While studying that concept I realised I needed an even more regime-robust strength gauge that looks back far enough to capture full market cycles (2–4 months). Therefore I completely rewrote the loop to compare against actual historical RSI values instead of fixed levels, added a 240-period median centerline, 3σ extreme bands, asymmetric thresholds, and visual signals. All parameters were extensively tested across dozens of major assets (BTC, ETH, SOL, SUI, BNB, XRP, TRX, DOGE, LINK, PAXG, CVX, HYPE, VIRTUAL + 20+ more cryptos; Magnificent 7 stocks, QQQ, SPX, XAUUSD) with the goal of achieving consistent profitability, high Sortino ratio and low drawdown in simple trend-following setups.
The final defaults represent the most robust compromise found — they keep you in real trends for dozens or hundreds of bars while staying almost silent in choppy, ranging markets.
Important Note
The optimization process is tailored to MY needs and have to be adjusted to you prefered timeframe!
I was mainly looking for an indicator that shows the underlying strength of an asset, the trend componant was only a bonus in my eyes.
How to use it
1. Green triangle below bar → score crosses above +15 → new bullish regime confirmed → enter or add to longs
2. Magenta triangle above bar → score crosses below –28 → exit longs or go cash/short
While score stays clearly positive → bullish bias hold
3. Score touching or breaking the 3σ bands → extreme conviction zone (add to winners or prepare for exhaustion)
Strength
Recommended defaults (My preference)
RSI length 46
Loop range 1–99
Long threshold +15
Short threshold –28
Median length 240
SD length 60
Recommended Universal Settings (Tested for low Max-Drawdown, high Sortino)
RSI length 44
Loop range 1–60
Long threshold +14
Short threshold –10
Median length 180
SD length 28
Works on every asset class, but the current settings are tuned for major liquid markets.
Disclaimer: This is not financial advice. Backtests are based on past results and are not indicative of future performance.

PEG RSI [Auto EPS Growth]The PEG RSI is a hybrid indicator that combines fundamental valuation with technical momentum. It applies the Relative Strength Index (RSI) directly to the Price/Earnings-to-Growth (PEG) Ratio.
Unlike traditional PEG indicators that require manual input for growth rates, this script automatically calculates the Compound Annual Growth Rate (CAGR) of Earnings Per Share (EPS) based on historical data.
Key Features
- Auto-Calculated Growth: Uses historical TTM Earnings Per Share (EPS) to calculate the CAGR over a user-defined period (Default: 4 years).
- Dynamic Valuation: Converts the static PEG ratio into an oscillator (RSI) to identify relative valuation extremes.
- Trend & Momentum: Visualizes the momentum of the PEG ratio relative to its own history.
Educational Case Study
This indicator is designed for educational purposes and research. Instead of relying on fixed overbought or oversold levels, users are encouraged to study the correlation between the PEG RSI and price action independently.
- Observe how the price reacts when the PEG RSI reaches upper or lower extremes.
- Different stocks may respect different RSI zones based on their growth stability.
- Use this tool to analyze how market valuation momentum shifts over time.
Settings:
- Years for CAGR Growth: Timeframe to calculate EPS growth (Default: 4 years).
- RSI Length: Lookback period for the RSI calculation (Default: 14).
Note: This indicator works best on stocks with a consistent history of earnings. It requires financial data to function (will not work on assets without EPS like Crypto or Forex).

DarkPool's RSi DarkPool's RSi is an enhanced momentum oscillator designed to automatically detect structural discrepancies between price action and the Relative Strength Index. While retaining the standard RSI visualization, this script overlays advanced divergence recognition logic to identify potential trend reversals.
The tool identifies pivot points in real-time and compares recent peaks and valleys against historical data. When the momentum of the RSI contradicts the direction of price action, the indicator highlights these events using dynamic trendlines, shape markers, and background coloring. A built-in dashboard table provides an immediate status check of active divergence signals.
Key Features
Automated Divergence Detection: Automatically spots both Regular Bullish and Regular Bearish divergences based on pivot lookback settings.
Dynamic Visuals: Draws physical lines connecting RSI peaks or troughs to visualize the divergence angle, alongside triangle markers indicating the signal direction.
Active Status Dashboard: A data table located on the chart monitors the current state of the market, flagging signals as "Active" when detected.
Standard RSI Overlay: Includes standard Overbought (70) and Oversold (30) reference lines for traditional momentum trading.
How to Use
1. Reading the Standard RSI The black line represents the Relative Strength Index.
Overbought (Above 70): Suggests the asset may be overvalued and due for a pullback.
Oversold (Below 30): Suggests the asset may be undervalued and due for a bounce.
Midline (50): Acts as a trend filter; values above 50 indicate bullish momentum, while values below 50 indicate bearish momentum.
2. Trading Divergences The primary function of this tool is to identify reversal setups.
Bullish Divergence (Green Triangle/Line): Occurs when Price makes a Lower Low, but the RSI makes a Higher Low. This indicates that selling momentum is exhausting and a price increase may follow.
Bearish Divergence (Red Triangle/Line): Occurs when Price makes a Higher High, but the RSI makes a Lower High. This indicates that buying momentum is fading and a price decrease may follow.
3. Visual Aids
Lines: The script draws solid lines directly on the RSI pane connecting the relevant pivot points to confirm the divergence slope.
Background Color: When a divergence is detected, the background of the indicator pane will highlight briefly (Green for Bullish, Red for Bearish) to draw attention to the new signal.
4. The Dashboard A small table in the bottom right corner tracks the status of the signals.
Status: ACTIVE: A divergence has been detected within the last 10 bars.
Status: None: No recent divergence patterns have been identified.
Disclaimer This indicator is provided for educational and informational purposes only. It does not constitute financial advice, investment recommendations, or a guarantee of future results. Trading cryptocurrencies and financial markets involves a high level of risk. Always perform your own due diligence before making any trading decisions.

RSI Rate of Change (ROC of RSI)The RSI Rate of Change (ROC of RSI) indicator measures the speed and momentum of changes in the RSI, helping traders identify early trend shifts, strength of price moves, and potential reversals before they appear on the standard RSI.
While RSI shows overbought and oversold conditions, the ROC of RSI reveals how fast RSI itself is rising or falling, offering a deeper view of market momentum.
How the Indicator Works
1. RSI Calculation
The indicator first calculates the classic Relative Strength Index (RSI) using the selected length (default 14). This measures the strength of recent price movements.
2. Rate of Change (ROC) of RSI
Next, it computes the Rate of Change (ROC) of the RSI over a user-defined period.
This shows:
Positive ROC → RSI increasing quickly → strong bullish momentum
Negative ROC → RSI decreasing quickly → strong bearish momentum
ROC crossing above/below 0 → potential early trend shift
What You See on the Chart
Blue Line: RSI
Red Line: ROC of RSI
Grey dotted Zero Line: Momentum reference
Why Traders Use It
The RSI ROC helps you:
Detect momentum reversals early
Spot bullish and bearish accelerations not visible on RSI alone
Identify exhaustion points before RSI reaches extremes
Improve entry/exit precision in trend and swing trading
Validate price breakouts or breakdowns with momentum confirmation
Best For
Swing traders
Momentum traders
Reversal traders
Trend-following systems needing early confirmation signals

Quantum Market Analyzer X7Quantum Market Analyzer X7 - Complete Study Guide
Table of Contents
1. Overview
2. Indicator Components
3. Signal Interpretation
4. Live Market Analysis Guide
5. Best Practices
6. Limitations and Considerations
7. Risk Disclaimer
________________________________________
Overview
The Quantum Market Analyzer X7 is a comprehensive multi-timeframe technical analysis indicator that combines traditional and modern analytical methods. It aggregates signals from multiple technical indicators across seven key analysis categories to provide traders with a consolidated view of market sentiment and potential trading opportunities.
Key Features:
• Multi-Indicator Analysis: Combines 20+ technical indicators
• Real-Time Dashboard: Professional interface with customizable display
• Signal Aggregation: Weighted scoring system for overall market sentiment
• Advanced Analytics: Includes Order Block detection, Supertrend, and Volume analysis
• Visual Progress Indicators: Easy-to-read progress bars for signal strength
________________________________________
Indicator Components
1. Oscillators Section
Purpose: Identifies overbought/oversold conditions and momentum changes
Included Indicators:
• RSI (14): Relative Strength Index - momentum oscillator
• Stochastic (14): Compares closing price to price range
• CCI (20): Commodity Channel Index - cycle identification
• Williams %R (14): Momentum indicator similar to Stochastic
• MACD (12,26,9): Moving Average Convergence Divergence
• Momentum (10): Rate of price change
• ROC (9): Rate of Change
• Bollinger Bands (20,2): Volatility-based indicator
Signal Interpretation:
• Strong Buy (6+ points): Multiple oscillators indicate oversold conditions
• Buy (2-5 points): Moderate bullish momentum
• Neutral (-1 to 1 points): Balanced conditions
• Sell (-2 to -5 points): Moderate bearish momentum
• Strong Sell (-6+ points): Multiple oscillators indicate overbought conditions
2. Moving Averages Section
Purpose: Determines trend direction and strength
Included Indicators:
• SMA: 10, 20, 50, 100, 200 periods
• EMA: 10, 20, 50 periods
Signal Logic:
• Price >2% above MA = Strong Buy (+2)
• Price above MA = Buy (+1)
• Price below MA = Sell (-1)
• Price >2% below MA = Strong Sell (-2)
Signal Interpretation:
• Strong Buy (6+ points): Price well above multiple MAs, strong uptrend
• Buy (2-5 points): Price above most MAs, bullish trend
• Neutral (-1 to 1 points): Mixed MA signals, consolidation
• Sell (-2 to -5 points): Price below most MAs, bearish trend
• Strong Sell (-6+ points): Price well below multiple MAs, strong downtrend
3. Order Block Analysis
Purpose: Identifies institutional support/resistance levels and breakouts
How It Works:
• Detects historical levels where large orders were placed
• Monitors price behavior around these levels
• Identifies breakouts from established order blocks
Signal Types:
• BULLISH BRK (+2): Breakout above resistance order block
• BEARISH BRK (-2): Breakdown below support order block
• ABOVE SUP (+1): Price holding above support
• BELOW RES (-1): Price rejected at resistance
• NEUTRAL (0): No significant order block interaction
4. Supertrend Analysis
Purpose: Trend following indicator based on Average True Range
Parameters:
• ATR Period: 10 (default)
• ATR Multiplier: 6.0 (default)
Signal Types:
• BULLISH (+2): Price above Supertrend line
• BEARISH (-2): Price below Supertrend line
• NEUTRAL (0): Transition period
5. Trendline/Channel Analysis
Purpose: Identifies trend channels and breakout patterns
Components:
• Dynamic trendline calculation using pivot points
• Channel width based on historical volatility
• Breakout detection algorithm
Signal Types:
• UPPER BRK (+2): Breakout above upper channel
• LOWER BRK (-2): Breakdown below lower channel
• ABOVE MID (+1): Price above channel midline
• BELOW MID (-1): Price below channel midline
6. Volume Analysis
Purpose: Confirms price movements with volume data
Components:
• Volume spikes detection
• On Balance Volume (OBV)
• Volume Price Trend (VPT)
• Money Flow Index (MFI)
• Accumulation/Distribution Line
Signal Calculation: Multiple volume indicators are combined to determine institutional activity and confirm price movements.
________________________________________
Signal Interpretation
Overall Summary Signals
The indicator aggregates all component signals into an overall market sentiment:
Signal Score Range Interpretation Action
STRONG BUY 10+ Overwhelming bullish consensus Consider long positions
BUY 4-9 Moderate to strong bullish bias Look for long opportunities
NEUTRAL -3 to 3 Mixed signals, consolidation Wait for clearer direction
SELL -4 to -9 Moderate to strong bearish bias Look for short opportunities
STRONG SELL -10+ Overwhelming bearish consensus Consider short positions
Progress Bar Interpretation
• Filled bars indicate signal strength
• Green bars: Bullish signals
• Red bars: Bearish signals
• More filled bars = stronger conviction
________________________________________
Live Market Analysis Guide
Step 1: Initial Assessment
1. Check Overall Summary: Start with the main signal
2. Verify with Component Analysis: Ensure signals align
3. Look for Divergences: Identify conflicting signals
Step 2: Timeframe Analysis
1. Set Appropriate Timeframe: Use 1H for intraday, 4H/1D for swing trading
2. Multi-Timeframe Confirmation: Check higher timeframes for trend context
3. Entry Timing: Use lower timeframes for precise entry points
Step 3: Signal Confirmation Process.
For Buy Signals:
1. Oscillators: Look for oversold conditions (RSI <30, Stoch <20)
2. Moving Averages: Price should be above key MAs
3. Order Blocks: Confirm bounce from support levels
4. Volume: Check for accumulation patterns
5. Supertrend: Ensure bullish trend alignment.
For Sell Signals:
1. Oscillators: Look for overbought conditions (RSI >70, Stoch >80)
2. Moving Averages: Price should be below key MAs
3. Order Blocks: Confirm rejection at resistance levels
4. Volume: Check for distribution patterns
5. Supertrend: Ensure bearish trend alignment.
Step 4: Risk Management Integration
1. Signal Strength Assessment: Stronger signals = larger position size
2. Stop Loss Placement: Use Order Block levels for stops
3. Take Profit Targets: Based on channel analysis and resistance levels
4. Position Sizing: Adjust based on signal confidence
________________________________________
Best Practices
Entry Strategies
1. High Conviction Entries: Wait for STRONG BUY/SELL signals
2. Confluence Trading: Look for multiple components aligning
3. Breakout Trading: Use Order Block and Trendline breakouts
4. Trend Following: Align with Supertrend direction.
Risk Management
1. Never Risk More Than 2% Per Trade: Regardless of signal strength
2. Use Stop Losses: Place at invalidation levels
3. Scale Positions: Stronger signals warrant larger (but still controlled) positions
4. Diversification: Don't rely solely on one indicator.
Market Conditions
1. Trending Markets: Focus on Supertrend and MA signals
2. Range-Bound Markets: Emphasize Oscillator and Order Block signals
3. High Volatility: Reduce position sizes, widen stops
4. Low Volume: Be cautious of breakout signals.
Common Mistakes to Avoid
1. Signal Chasing: Don't enter after signals have already moved significantly
2. Ignoring Context: Consider overall market conditions
3. Overtrading: Wait for high-quality setups
4. Poor Risk Management: Always use appropriate position sizing
________________________________________
Limitations and Considerations
Technical Limitations
1. Lagging Nature: All technical indicators are based on historical data
2. False Signals: No indicator is 100% accurate
3. Market Regime Changes: Indicators may perform differently in various market conditions
4. Whipsaws: Possible in choppy, sideways markets.
Optimal Use Cases
1. Trending Markets: Performs best in clear trending environments
2. Medium to High Volatility: Requires sufficient price movement for signals
3. Liquid Markets: Works best with adequate volume and tight spreads
4. Multiple Timeframe Analysis: Most effective when used across different timeframes.
When to Use Caution
1. Major News Events: Fundamental analysis may override technical signals
2. Market Opens/Closes: Higher volatility can create false signals
3. Low Volume Periods: Signals may be less reliable
4. Holiday Trading: Reduced participation affects signal quality
________________________________________
Risk Disclaimer
IMPORTANT LEGAL DISCLAIMER FROM aiTrendview
WARNING: TRADING INVOLVES SUBSTANTIAL RISK OF LOSS
This Quantum Market Analyzer X7 indicator ("the Indicator") is provided for educational and informational purposes only. By using this indicator, you acknowledge and agree to the following terms:
No Investment Advice
• The Indicator does NOT constitute investment advice, financial advice, or trading recommendations
• All signals generated are based on historical price data and mathematical calculations
• Past performance does not guarantee future results
• No representation is made that any account will achieve profits or losses similar to those shown.
Risk Acknowledgment
• TRADING CARRIES SUBSTANTIAL RISK: You may lose some or all of your invested capital
• LEVERAGE AMPLIFIES RISK: Margin trading can result in losses exceeding your initial investment
• MARKET VOLATILITY: Financial markets are inherently unpredictable and volatile
• TECHNICAL ANALYSIS LIMITATIONS: No technical indicator is infallible or guarantees profitable trades.
User Responsibility
• YOU ARE SOLELY RESPONSIBLE for all trading decisions and their consequences
• CONDUCT YOUR OWN RESEARCH: Always perform independent analysis before making trading decisions
• CONSULT PROFESSIONALS: Seek advice from qualified financial advisors
• RISK MANAGEMENT: Implement appropriate risk management strategies
No Warranties
• The Indicator is provided "AS IS" without warranties of any kind
• aiTrendview makes no representations about the accuracy, reliability, or suitability of the Indicator
• Technical glitches, data feed issues, or calculation errors may occur
• The Indicator may not work as expected in all market conditions.
Limitation of Liability
• aiTrendview SHALL NOT BE LIABLE for any direct, indirect, incidental, or consequential damages
• This includes but is not limited to: trading losses, missed opportunities, data inaccuracies, or system failures
• MAXIMUM LIABILITY is limited to the amount paid for the indicator (if any)
Code Usage and Distribution
• This indicator is published on TradingView in accordance with TradingView's house rules
• UNAUTHORIZED MODIFICATION or redistribution of this code is prohibited
• Users may not claim ownership of this intellectual property
• Commercial use requires explicit written permission from aiTrendview.
Compliance and Regulations
• VERIFY LOCAL REGULATIONS: Ensure compliance with your jurisdiction's trading laws
• Some trading strategies may not be suitable for all investors
• Tax implications of trading are your responsibility
• Report trading activities as required by law
Specific Risk Factors
1. False Signals: The Indicator may generate incorrect buy/sell signals
2. Market Gaps: Overnight gaps can invalidate technical analysis
3. Fundamental Events: News and economic data can override technical signals
4. Liquidity Risk: Some markets may have insufficient liquidity
5. Technology Risk: Platform failures or connectivity issues may prevent order execution.
Professional Trading Warning
• THIS IS NOT PROFESSIONAL TRADING SOFTWARE: Not intended for institutional or professional trading
• NO REGULATORY APPROVAL: This indicator has not been approved by any financial regulatory authority
• EDUCATIONAL PURPOSE: Designed primarily for learning technical analysis concepts
FINAL WARNING
NEVER INVEST MONEY YOU CANNOT AFFORD TO LOSE
Trading financial instruments involves significant risk. The majority of retail traders lose money. Before using this indicator in live trading:
1. Practice on paper/demo accounts extensively
2. Start with small position sizes
3. Develop a comprehensive trading plan
4. Implement strict risk management rules
5. Continuously educate yourself about market dynamics
By using the Quantum Market Analyzer X7, you acknowledge that you have read, understood, and agree to this disclaimer. You assume full responsibility for all trading decisions and their outcomes.
Contact: For questions about this disclaimer or the indicator, contact aiTrendview through official TradingView channels only.
________________________________________
This study guide and indicator are published on TradingView in compliance with TradingView's community guidelines and house rules. All users must adhere to TradingView's terms of service when using this indicator.
Document Version: 1.0
Publisher: aiTrendview
________________________________________
Disclaimer
The content provided in this blog post is for educational and training purposes only. It is not intended to be, and should not be construed as, financial, investment, or trading advice. All charting and technical analysis examples are for illustrative purposes. Trading and investing in financial markets involve substantial risk of loss and are not suitable for every individual. Before making any financial decisions, you should consult with a qualified financial professional to assess your personal financial situation.

VSLRT with DivergencesOverview
This indicator combines Volume-Synchronized Linear Regression Trend (VSLRT) analysis with multi-indicator divergence detection to provide comprehensive market momentum and reversal signals. It displays volume-weighted price trends in both short-term and long-term timeframes, while simultaneously detecting divergences across 10 different technical indicators.
Key Features
VSLRT (Volume-Synchronized Linear Regression Trend):
Short-term and long-term trend analysis using linear regression
Volume-weighted calculations that account for buying vs selling pressure
Color-coded histogram showing trend strength and direction
Forecast projection showing anticipated trend continuation
Divergence-adjusted forecasting for enhanced prediction accuracy
Multi-Indicator Divergence Detection:
The indicator simultaneously monitors divergences across:
MACD (Moving Average Convergence Divergence)
MACD Histogram
RSI (Relative Strength Index)
Stochastic Oscillator
CCI (Commodity Channel Index)
Momentum
OBV (On-Balance Volume)
Volume-Weighted MACD
Chaikin Money Flow
Money Flow Index
Divergence Types:
Regular Bullish Divergence (potential reversal to upside)
Regular Bearish Divergence (potential reversal to downside)
Hidden Bullish Divergence (trend continuation upward)
Hidden Bearish Divergence (trend continuation downward)
How It Works
VSLRT Calculations:
The indicator calculates linear regression slopes for both price and volume, separating buying volume from selling volume. The histogram displays:
Green columns: Bullish price movement with strong buying volume
Red columns: Bearish price movement with strong selling volume
Shaded columns: Weaker conviction in the current trend
Thick line: Long-term trend direction
Divergence Detection:
The script automatically scans for divergences by comparing:
Price action (higher highs/lower lows)
Indicator values at pivot points
When price and indicators move in opposite directions, a divergence is detected
Divergences are displayed as labels on the histogram showing:
Which indicators are diverging
Number of simultaneous divergences (stronger signal when multiple indicators agree)
Color-coded by divergence type
Customizable Settings
VSLRT Settings:
Short-term length (default: 20)
Long-term length (default: 50)
Forecast bars (1-50, default: 10)
Divergence forecast adjustment factor
Custom colors for all trend states
Divergence Settings:
Pivot period for divergence detection
Source (Close or High/Low)
Divergence type (Regular, Hidden, or Both)
Minimum number of divergences to display
Maximum pivot points and bars to check
Toggle individual indicators on/off
Custom colors for each divergence type
Label display options (Full names, First letter, or Don't show)
Show divergence count option
Trading Applications
Trend Following:
Use VSLRT histogram to identify trend direction and strength
Enter trades when short-term and long-term trends align
Monitor forecast bars for potential trend continuation
Reversal Trading:
Watch for multiple regular divergences (3+ indicators)
Confirm with VSLRT color changes
Higher divergence count = stronger reversal signal
Trend Continuation:
Hidden divergences suggest trend will continue
Use during pullbacks in strong trends
Combine with VSLRT forecast for entry timing
Risk Management:
Divergence alerts can signal potential exits
VSLRT color changes can indicate stop-loss levels
Forecast helps anticipate trend exhaustion
Alert Conditions
Built-in alert conditions for:
Positive Regular Divergence Detected
Negative Regular Divergence Detected
Positive Hidden Divergence Detected
Negative Hidden Divergence Detected
Any Positive Divergence
Any Negative Divergence
Tips for Best Results
Multiple Timeframe Analysis: Check divergences on higher timeframes for more reliable signals
Confirmation: Wait for bar close (enabled by default) to avoid false signals
Volume Context: Stronger VSLRT signals occur during high volume periods
Divergence Count: More simultaneous divergences = higher probability signal
Trend Alignment: Best results when divergences align with overall trend direction
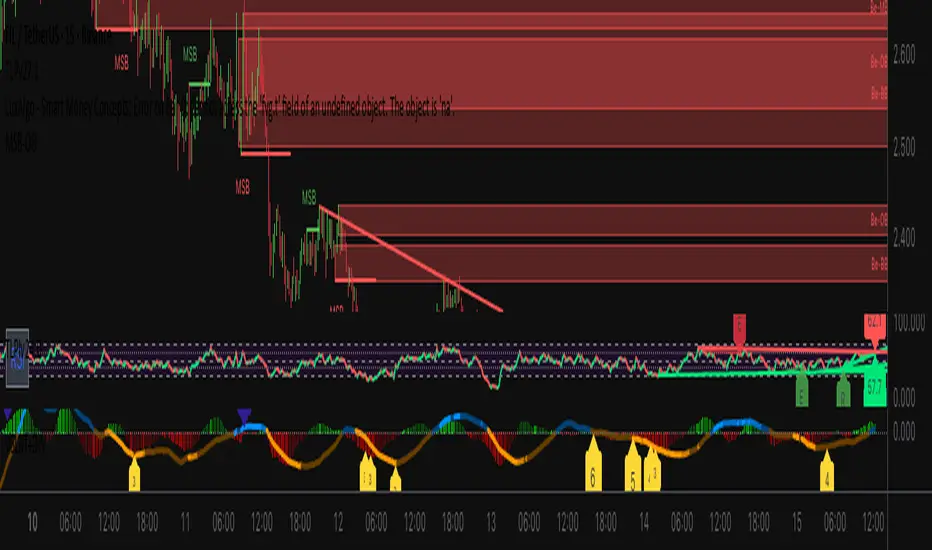
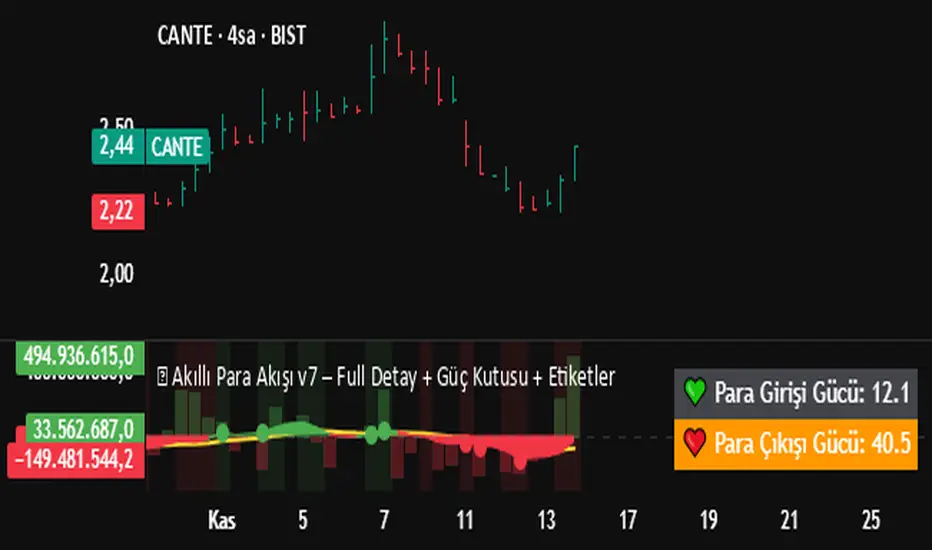
💰 Akıllı Para Akışı v7 – Full Detay + Güç Kutusu + Etiketler✅ Everything Included:
✔ Money Flow
✔ RSI (Relative Strength Index)
✔ Momentum Filter
✔ Price Change Analysis
✔ Smart Money Zone Detection
✔ Strength Score (0–100)
✔ Dual Power Box (Inflow/Outflow Strength)
✔ Full-Detail BUY/SELL Labels
✔ Alert System (BUY & SELL)
✔ Optimized for Bottom Panel Display
RSI + MACD Multi-Timeframe StrategyThis strategy combines the Relative Strength Index (RSI) from the daily timeframe with the Moving Average Convergence Divergence (MACD) from the 4-hour timeframe to generate precise long entry and exit signals.
The system uses a multi-timeframe approach to align longer-term trend conditions with shorter-term momentum shifts — allowing traders to catch dips with confirmation and exit before reversals.
🧠 Strategy Logic
✅ Long Entry Condition:
- RSI on the daily (1D) timeframe is oversold (below your defined threshold)
- MACD on the 4H timeframe crosses above the signal line
→ A long trade is opened when these two align
✅ Long Exit Condition:
- RSI on the daily timeframe is overbought
- MACD on the 4H timeframe crosses below the signal line
→ The long trade is closed when these two conditions are met
💡 This strategy currently supports long entries only. Short logic can be added if needed.
📊 Indicator Components
🔹 RSI (Relative Strength Index):
- A momentum oscillator that measures the speed and magnitude of price changes.
- Helps identify overbought (potential sell) and oversold (potential buy) conditions.
- Applied on the 1D timeframe (by default) to reflect broader market trend or exhaustion levels.
🔹 MACD (Moving Average Convergence Divergence):
- A trend-following momentum indicator based on moving averages.
- The MACD Line (fast EMA - slow EMA) crossing above the Signal Line indicates bullish momentum.
- Used here on the 4-hour timeframe (by default) for shorter-term momentum confirmation.
🔹 Multi-Timeframe (MTF) Logic:
- Uses request.security() to pull higher timeframe data (1D for RSI, 4H for MACD).
- Ensures no repainting, as it only uses closed candles from the higher timeframe.
- Aligns longer-term signals with shorter-term entries, reducing false signals.
📈 Plotting Options
The script includes a plot selector input allowing you to toggle between:
- RSI Plot (with overbought/oversold lines)
- MACD Plot (MACD line and signal line)
- This helps visualize signal conditions clearly on your chart.
🛠 Customization
- RSI & MACD settings are fully configurable
- RSI and MACD timeframes can be adjusted independently
⚠️ Disclaimer
This strategy is provided for educational and informational purposes only.
It is not financial advice or a recommendation to buy or sell any asset.
Past performance does not guarantee future results. Always test strategies in a simulated environment before live use, and consult with a licensed financial advisor for investment decisions.

RMBS Smart Detector - Multi-Factor Momentum System v2# RMBS Smart Detector - Multi-Factor Momentum System
## Overview
RMBS (Smart Detector - Multi-Factor Momentum System) is a proprietary scoring method developed by Ario, combining normalized RSI and Bollinger band positioning into a single composite metric.
---
## Core Methodology
### Buy/Sell Logic
Marker (green or red )appear when **all four filters** pass:
**1. RMBS Score (Momentum Strength)**
From the formula Bellow
Combined Range: -10 (extreme bearish) to +10 (extreme bullish)
Signal Thresholds:
• BUY: Score > +3.0
• SELL: Score < -3.0
2. EMA Trend Filter
BUY: EMA(21) > EMA(55) → Uptrend confirmed
SELL: EMA(21) < EMA(55) → Downtrend confirmed
3. ADX Strength Filter
Minimum ADX: 25 (adjustable 20-30)
ADX > 25: Trending market → Signal allowed
ADX < 25: Range-bound → Signal blocked
4. Alternating Logic
Prevents signal spam by requiring alternation:
✓ BUY → SELL → BUY (allowed)
✗ BUY → BUY → BUY (blocked)
________________________________________
Mathematical Foundation
RMBS Formula: scoring method developed by Ario
RMBS = (RSI – 50) / 10 + ((BB_pos – 50) / 10)
where:
• RSI = Relative Strength Index (close, L)
• BB_pos = (Close – (SMA – 2 σ)) / ((SMA + 2 σ) – (SMA – 2 σ)) × 100
• σ = standard deviation of close over lookback L
• SMA = simple moving average of close over lookback L
• L = rmbs_length (period setting)
This produces a normalized composite score around zero:
• Positive → bullish momentum and upper band dominance
• Negative → bearish momentum and lower band pressure
• Near 0 → neutral or transitional zone
Input Parameters
ADX Threshold (default: 25)
• Lower (20-23): More signals, less filtering
• Higher (28-30): Fewer signals, stronger trends
• Recommended: 25 for balanced filtering
Signal Thresholds
• BUY: +3.0 (adjustable)
• SELL: -3.0 (adjustable)
Visual Options
• Marker colors
• Background highlights
• Alert settings
________________________________________
Usage Guidelines
How to Interpret
• 🟢 Green Marker: All conditions met for Bull condition
• 🔴 Red Marker: All conditions met for Bear condition
• No Marker: Waiting for confirmation
________________________________________
Important Disclaimers
⚠️ Educational Purpose Only
• This tool demonstrates multi-factor technical analysis concepts
• Not financial advice or trade recommendations
• No guarantee of profitability
⚠️ Known Limitations
• Less effective in ranging/choppy markets
• Requires proper risk management (stop-loss, position sizing)
• Should be combined with fundamental analysis
⚠️ Risk Warning
Trading involves substantial risk of loss. Past performance does not indicate future results. Always conduct your own research and consult professionals before trading.
________________________________________
Open Source
Full Pine Script code available for educational study and modification. Feedback and improvement suggestions welcome.
“All logic is presented for research and educational visualization.”

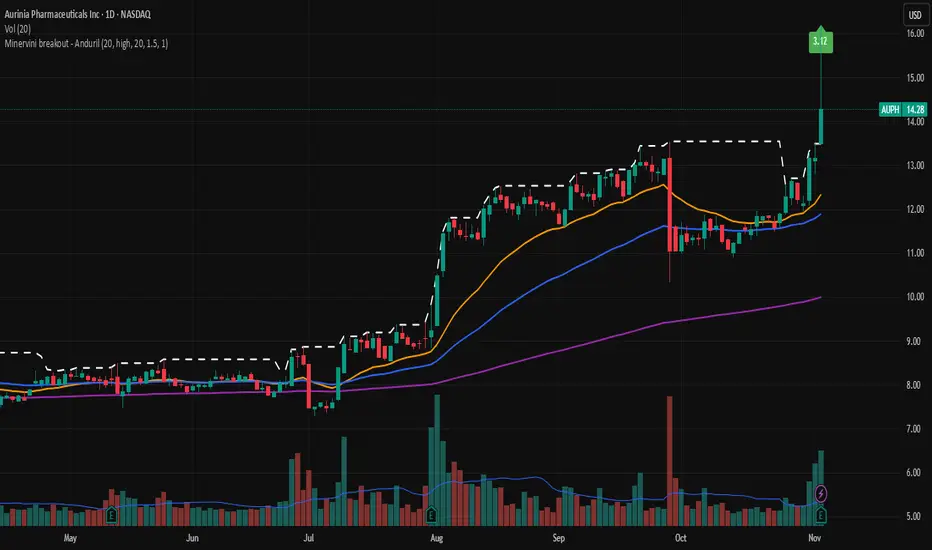
Minervini breakout - AndurilThis indicator checks the Mark Minerivini trend template as well checks consolidation areas and breakout.
Checks the highest closing price of last x days (default 20 days), exluding current day and draws a white dashed line, Calculates the relative volume of the current day. Calculates EMA 21, EMA50 and EMA200 and draws on the graph to define trend.
Gives a buy signal in green (writing relative strength of that day inside of green arrow) if:
1) Current price> breakout price* 0.98
2) Current price > EMA21 >EMA50>EMA200
3) Current price > 52 week high*0.75
4) Current price > 52 week low*1.3
5) EMA 200 of today > EMA 200 of 10 bar ago > EMA 200 of 20 bar ago
6) Relative volume of the day > 1.5
RSI Breakout Zones█ OVERVIEW
“RSI Breakout Zones” is a technical analysis tool that identifies significant zones on the chart based on the Relative Strength Index (RSI). The indicator maps overbought (OB) and oversold (OS) zones using boxes, then extends them until the next zone of the same type is detected, highlighting breakout points to aid in trade entry decisions. These zones often serve as areas of consolidation, support, or resistance.
█ CONCEPTS
The indicator identifies overbought (above 70) and oversold (below 30) zones, drawing boxes that extend until the next zone of the same type (OB for OB, OS for OS) is detected. Breakout signals are generated when the price crosses the zone boundaries, indicating potential shifts in market momentum.
Why are RSI zones important? These zones represent areas of extreme market sentiment, often leading to corrections or reversals. Overbought zones suggest potential selling pressure, while oversold zones indicate buying opportunities. After a breakout, a zone may switch roles, e.g., from support to resistance or vice versa, making it a key element in price action analysis. Larger zones, formed during high volatility, may attract price for retests due to stronger imbalances in buyer/seller dynamics. Consolidation often occurs within these zones as the market seeks equilibrium before further moves. However, in strong trends, zones may be decisively broken without immediate pullbacks, and their significance depends on their position relative to key support and resistance levels.
█ FEATURES
- RSI Zone Detection: Calculates RSI with a customizable length (default 14) and identifies overbought/oversold zones based on user-defined levels (default 70/30), drawing boxes that dynamically adjust to price action within the zone.
- Customizable Boxes: Zones extend until the next zone of the same type is detected. The indicator draws zones with adjustable colors for overbought (red) and oversold (green) areas, with options for box and zone transparency.
- Breakout Signals: Generates upward (green triangle) and downward (red triangle) breakout signals when the price crosses the top or bottom of a zone. Signals appear below or above the bar, indicating potential trade entry points.
- Midline: Automatically draws a dashed line at the midpoint of each zone, helping traders assess price behavior within the zone and potential halfway retests.
- Box Management: Option to remove outdated boxes.
- Alerts: Built-in support for alerts on breakout signals, enabling traders to receive notifications for key zone crossings.
█ HOW TO USE
Add to Chart: Apply the indicator to your TradingView chart via the Pine Editor or Indicators menu.
Configure Settings:
- RSI Settings: Adjust RSI Length (default 14), Overbought Level (default 70), and Oversold Level (default 30) to tailor zone detection sensitivity—higher lengths smooth signals for longer-term analysis.
- Box Settings: Configure colors and transparency for overbought (red) and oversold (green) zones, including box transparency (default 90) and zone transparency (default 90).
- Signal Settings: Customize breakout signal colors (green for upward, red for downward) and enable/disable keeping boxes after RSI normalization.
Interpreting Signals:
- Upward Breakout Signal: A green triangle below the bar indicates a breakout, suggesting potential bullish momentum and trend continuation or reversal.
- Downward Breakout Signal: A red triangle above the bar indicates a breakout, suggesting potential bearish momentum.
- RSI Zones: If the price re-enters a zone after a breakout, it may signal a false breakout or consolidation; persistent zones can act as future support/resistance levels. Consolidation often occurs within these zones as the market seeks equilibrium.
- Use signals alongside other technical analysis tools for confirmation, such as moving averages (to confirm trend direction), Fibonacci levels (to identify key price zones), or volume indicators (to validate breakout strength). Analyze RSI zones on higher timeframes for stronger signals due to broader market context.
█ APPLICATIONS
- Momentum Trading: Use RSI zones as overbought/oversold filters. In an uptrend, look for buying opportunities on upward breakouts, and in a downtrend, on downward breakouts. Combining with MACD crossovers, Fibonacci levels, or pivot points enhances zone significance.
- Inter-Zone Trading: Utilize breakouts from one RSI zone and hold the position until reaching the next zone, which may act as a target level or reversal point.
█ NOTES
- Test the indicator across different timeframes and markets (stocks, forex, crypto) to optimize RSI length and levels for your trading style.
- For best results, use in trending markets where RSI extremes are more predictive; in ranging markets, additional filters are recommended to reduce false signals.
- Always combine with risk management; RSI zones alone do not guarantee reversals, and false breakouts may occur in low-liquidity environments.

AUTOMATIC ANALYSIS MODULE🧭 Overview
“Automatic Analysis Module” is a professional, multi-indicator system that interprets market conditions in real time using TSI, RSI, and ATR metrics.
It automatically detects trend reversals, volatility compressions, and momentum exhaustion, helping traders identify high-probability setups without manual analysis.
⚙️ Core Logic
The script continuously evaluates:
TSI (True Strength Index) → trend direction, strength, and early reversal zones.
RSI (Relative Strength Index) → momentum extremes and technical divergences.
ATR (Average True Range) → volatility expansion or compression phases.
Multi-timeframe ATR comparison → detects whether the weekly structure supports or contradicts the local move.
The system combines these signals to produce an automatic interpretation displayed directly on the chart.
📊 Interpretation Table
At every new bar close, the indicator updates a compact dashboard (bottom right corner) showing:
🔵 Main interpretation → trend, reversal, exhaustion, or trap scenario.
🟢 Micro ATR context → volatility check and flow analysis (stable / expanding / contracting).
Each condition is expressed in plain English for quick decision-making — ideal for professional traders who manage multiple charts.
📈 How to Use
1️⃣ Load the indicator on your preferred asset and timeframe (recommended: Daily or 4H).
2️⃣ Watch the blue line message for the main trend interpretation.
3️⃣ Use the green line message as a volatility gauge before entering.
4️⃣ Confirm entries with your own strategy or price structure.
Typical examples:
“Possible bullish reversal” → early accumulation signal.
“Compression phase → wait for breakout” → avoid premature trades.
“Confirmed uptrend” → trend continuation zone.
⚡ Key Features
Real-time auto-interpretation of TSI/RSI/ATR signals.
Detects both bull/bear traps and trend exhaustion zones.
Highlights volatility transitions before breakouts occur.
Works across all assets and timeframes.
No repainting — stable on historical data.
✅ Ideal For
Swing traders, position traders, and institutional analysts who want automated context recognition instead of manual indicator reading.

Composite Momentum System⚙️ Composite Momentum System — RSI + CCI + Momentum + MFI + (DI·ADX) × MACD² (4-Color Smoothed Signal)
This advanced indicator fuses multiple momentum, volume, and trend components into one unified oscillator, dynamically visualized around a zero line. It helps traders identify powerful directional moves, trend reversals, and momentum exhaustion far earlier than traditional MACD or RSI alone.
🧩 Core Formula
Composite = ((RSI + CCI + Momentum + MFI) + (((DI− × −1) + DI+) × ADX)) × (MACD²)
RSI – captures relative strength and short-term momentum
CCI – measures deviation from price mean (volatility & cycles)
Momentum – shows raw velocity of price change
MFI – volume-weighted momentum, adds money flow confirmation
DI / ADX – directional strength and market trend intensity
MACD² – amplifies strong momentum moves and filters weak noise
🌈 Visual Design & Features
Zero-Centered Histogram:
Green = Bullish momentum, Red = Bearish momentum
MACD Signal Line (4 Colors):
🟢 Positive & Rising → strong up momentum
🟡 Positive & Falling → weakening uptrend
🔴 Negative & Falling → strong downtrend
🟠 Negative & Rising → possible bearish fade or reversal
Adjustable Signal Smoothing:
Choose MA type (SMA, EMA, RMA, WMA, VWMA) and custom smoothing length for cleaner visualization.
ATR Normalization:
Optional setting to keep MACD and composite values consistent across instruments.
Centering Options:
RSI and MFI can be centered (−50/+50) to balance oscillation around zero.
🎯 How to Use
Above 0: Bullish composite energy → favor long setups.
Below 0: Bearish composite energy → favor short setups.
Signal line color changes highlight momentum acceleration or slowdown.
Crosses through zero often precede major shifts or breakout moments.
⚡ Best Practice
Use this indicator as a momentum strength filter in confluence with price action or volume patterns.
Combine it with VWAP, higher-timeframe trend, or support/resistance zones for high-probability entries.

Free Stock ScreenerMissing great trade opportunities is annoying, and unless you have 12 screens or only trade one market, you are missing a lot of trades. To fix that, we created this free stock screener so you get notified instantly of potential great trading conditions in real time, right on your chart.
You get notified of trading benchmarks being met by the value being displayed on the scanner as well as a color change so that it grabs your attention and makes you aware that you should take a look at the other market and look for a potential trade. It also has built in alerts so you can have an alert notification go off when any of your trading conditions are met instead of needing to watch the scanner for color changes.
The screener will change the ticker symbol background color to red green when price is above or below the previous daily range and above or below both VWAPs. This signals that the ticker is trending, which typically means it is a great time to trade that market and follow the trend.
This free stock screener allows you to scan up to 10 different markets at the same time for various different conditions so you always know what is going on with your favorite trading symbols. If you want to scan more tickers, just add the indicator to your chart again and change the table position to the other side of the screen and update the tickers on the 2nd screener, allowing you to have 20 tickers at a time.
The scanner can be fully customized by changing the markets that it screens and turning on or off as many of them as you would like. You can also turn on or off any of the different data sets so that you only get information about trading conditions that matter to you.
The screener can provide data on any type of market, such as stocks, crypto, futures, forex and more. Each ticker can be adjusted to whatever market you would like it to scan for data in the settings panel, the only limitation is that it will not provide data for the VWAP and volume trend score if the ticker you are screening does not provide volume data.
Screener Features
The scanner will provide the following types of data for each ticker that is turned on:
Volume - Provides a volume score compared to the average volume and notifies you of higher than normal volume and volume spikes on individual bars by changing colors.
Volatility - Provides a volatility score compared to the average volatility and notifies you of higher than normal volatility by changing colors.
Oscillator - Choose between the RSI or CCI. The value of that oscillator will be displayed and will notify you when values are in extreme ranges such as overbought or oversold conditions according to the threshold values you enter in the settings panel. When those thresholds have been breached, you will be notified by it changing color.
Big Candles - Compares the current candle to average previous candle sizes, and changes color to notify you of big candles including a big top wick, big bottom wick, big candle body and big candle high to low range.
Daily Level Touches & Trends - Calculates and displays various daily candle and intraday open price levels that act as support and resistance. Notifies you when price is touching any of the daily levels that are turned on. The levels you can have on are as follows: previous day high, previous day low or previous day open. It also will notify you when price is touching the current day’s open, NY 930am open, Asia 8pm open, London 2am open and NY midnight 12am open. It will also say “Above” if price is above the previous day’s high or it will say “Below” if price is below the previous day’s low. The color of the cell will also change when a level touch is happening or price is above the previous day high or below the previous day low.
VWAP - Choose from 2 different VWAP lengths, default settings are daily and weekly VWAPs. You will get notified if price touches either of the VWAPs and they will also say “Above” or “Below” if price is currently above or below each VWAP.
How To Use The Screener To Help You Trade
The main purpose of the screener is to scan other markets and notify you of potential good trading opportunities such as price bouncing off of the daily levels or VWAPs. It can also be used to know when price is trending according to the VWAPs and daily levels. Lastly, you can use it to know how the volume and volatility trends are currently which gives you more confidence in taking a trade with this data when volume and volatility are present.
Volume Score
When volume is high, this represents a good time to trade because there are many market participants and price is likely to be volatile while there is high volume which can present a lot of good trade setups for you to take.
The volume score shown on the screener measures the current volume trend compared to previous volume trends and calculates that into a score based on 100 being the same as the previous volume trend. So any value above 100 means it is high volume and any value less than 100 means it is lower volume than normal.
In the settings panel, you can adjust the volume threshold that needs to be met for a volume notification to show up. The default setting is at 120, so you will get notified when the current volume trend score is 120 or higher or you can adjust that threshold value to whatever value you prefer.
It also will notify you when there is a volume spike on the current bar. This is determined by calculating an average of the recent volume totals and then checking to see if the current bar is greater than or equal to that average multiplied by 3. So if a single bar has volume that is greater than 3 times what the average volume is, then you will get a notification that says “Spike” to make you aware of that volume spike.
The volume trend threshold, volume spike multiplier and lookback length for the average volume used in volume spike calculations can all be adjusted in the settings panel to fit your desired preferences.
Volatility Score
High volatility can mean it is a great time to trade because the market is moving quickly and providing large enough movements that you can get in and out in a short amount of time, while still accruing decent sized trade PnL.
The volatility score will calculate the current volatility for each market compared to previous conditions and then divide the current volatility by the average volatility to give you a volatility score. Anything over 100 means the market is decently volatile and you should look at that market to find potential trade setups to execute on. Anything below 100 means the market is not very volatile and it is usually best to just wait until volatility returns before you start trading again.
The screener will notify you when the volatility score is above the threshold you set. The default value is set to 90, but can be adjusted to your preference. Pay attention to any market that shows an alert and take a look at that chart because the high volatility may present a good trade setup for you in the near future.
Oscillator Score
The oscillator data can be switched between Relative Strength Index(RSI) and Commodity Channel Index(CCI).
The RSI provides a value between 0 and 100 that indicates the momentum and strength of the recent price action. Many traders use the extremes of the 0-100 range to signal overbought or oversold conditions and use that as a sign to look for price to reverse in the near future. The typical values used for this and the default settings to provide notifications are: 70 for overbought and 30 for oversold. The scanner will notify you when the RSI value is considered overbought or oversold so you know to take a look at the chart and analyze if it is ready for a trade to be taken.
The CCI provides a value that can be used to determine the trend strength of the underlying asset when the oscillator moves above 100 or below -100. These extreme values are outside of the normal accumulation range and signify that price is moving strongly in that direction so it may be a good time to take a trade in the direction of the trend. The scanner will show you the value of the CCI for each market and notify you if that value is above 100 or below -100.
Both RSI and CCI settings can be adjusted in the settings panel to your desired settings so you have the exact oscillator settings you prefer to use as well as the exact values that you want to use for being notified.
Big Candles
Big candles can mean that many traders are buying or selling at the same time and many times indicate a good signal to trade in that same direction. That is why we included this calculation in the screener, so you are always aware when a large candle prints.
It calculates the average size of the recent candles and then uses that average as the benchmark to determine if the current candle is considered big and worthy of notifying you to take a look at that chart.
You can adjust the multiplier used for the big candle threshold to whatever you desire, but the default setting is 3 which means the candle will be considered big and notify you if it is 3 times as large as an average candle.
The big candles data will track the following candle values and notify you with these labels:
High to Low candle size = HL
Candle Body from open to close candle size = OC
Top Wick size = TW
Bottom Wick size = BW
Daily Level Touches & Trend
Daily level touches are excellent levels to watch for price to bounce because they often act as support and resistance levels for intraday trading. The scanner will track each market and notify you when the current candle is touching any of the daily levels that you have turned on in the settings panel.
The main levels that are turned on by default and are useful for all markets and how they will be labeled on the scanner are as follows:
Previous Day High = High
Previous Day Low = Low
Previous Day Open = < Open
Previous Day Close = Close
Current Day Open = Open
We also included some extra levels that are useful for futures traders. They are as follows:
NY 930am Open = 930am
NY 12am Midnight Open = 12am
Asia Open at 8pm NY time = Asia
London Open at 2am NY Time = London
Watch how price reacts to these levels and then trade the bounces off of these levels if the price action confirms that it is going to respect that level.
When price is currently above the previous day high, the scanner will say “Above” and show a green color, indicating a bullish trend and that price is above the previous daily candle’s high.
When price is currently below the previous day low, the scanner will say “Below” and show a red color, indicating a bearish trend and that price is below the previous daily candle’s low.
Pay attention to when price is trending above or below the previous daily candle as those trends can provide excellent trend trading opportunities.
The daily levels that you have turned on in the settings will also show as lines on the chart and include a label next to them, identifying each level so you know what each line represents. You can turn on or off all of the lines shown on the chart in the main settings or turn them off one by one in the style panel of the settings. Labels can also be turned on or off for all of the lines in the main settings panel. You can adjust the label positioning in the Label Offset section of the settings panel.
VWAP Touches & Trend
VWAP stands for volume weighted average price and is a very popular tool that traders use to determine trend direction based on volume as well as an excellent level to trade price bounces off of.
The typical VWAP time period used is Daily, which means the volume weighted average price will reset at the beginning of a new day. We set the first VWAP to be the daily VWAP by default and the second one to be the weekly VWAP. You can adjust both of the time periods to be any of the provided time lengths that you choose.
The screener will show “Above” with a green background color when price is above the VWAP, indicating a bullish trend. It will show “Below” with a red background color when price is below the VWAP, indicating a bearish trend. When both VWAPs are showing Above or Below, you can expect price to trend in that direction, so look for pullbacks you can trade in the direction of the trend. If the VWAPs are showing different directions, then you should expect to bounce back and forth between the VWAPs, but be careful and watch out for price to break beyond either one and start a trend.
When the current candle is touching the VWAP, the scanner will change colors and say VWAP to notify you that price is touching the VWAP and you should look at that chart and analyze the market for a potential bounce off of the VWAP to trade.
Trending Market Signals
Strong trends are excellent markets to trade and can many times provide excellent trading opportunities that don’t require expert price action reading skills to be able to take winning trades from. That is why we included a signal to notify you of a strong trending market.
The strong trending market will show up as a green or red background color for the ticker name. If the color of the ticker name is green, it is notifying you that the price is above the previous daily high, above VWAP 1 and above VWAP 2 and is a good market to look for bullish trend trades. If the color of the ticker name is red, it is notifying you that the price is below the previous daily low, below VWAP 1 and below VWAP 2 and is a good market to look for bearish trend trades.
Changing The Tickers It Scans
To change the tickers that the indicator scans, scroll near the bottom of the settings panel and select the ticker symbol you want to update and then search for the exact symbol you want to use. If you want to scan less tickers, then just turn some of the tickers off that you don’t need.
Scanning More Than 10 Tickers
If you want to scan more than 10 tickers, you can add the scanner to your chart again and then just change the table position to the other side of the screen. This will allow you to scan 10 more tickers that will show up separately. Then if you want even more, just add the indicator to your chart again and update the table position until you have as many markets as you want. The table position setting can be found at the bottom of the main settings panel.
Alerts
The screener has alerts that can be used to notify you when any of the data set thresholds have been met or if price is touching one of the levels. You can set alerts for the following events:
Bullish Trend Alert - Price is above the previous daily high and above both VWAPs.
Bearish Trend Alert - Price is below the previous daily low and below both VWAPs.
High Volume Alert - Volume is higher than the threshold or a volume spike is detected.
High Volatility Alert - Volatility is higher than the threshold.
Oscillator Is Extended Alert - Oscillator value has exceeded the upper or lower threshold.
Big Candle Alert - A big candle has been detected.
Daily Level Touch Alert - One of the daily levels that is turned on is being touched.
VWAP Touch Alert - One of the 2 VWAPs are being touched.
An alert will trigger when any one of tickers on your scanner meets the alert conditions, so when you see the alert, you will need to go to your chart and look at the scanner to see which ticker it was and then navigate to that chart to look for potential trade setups.
The alerts will use the exact same settings you have configured in the settings panel to send you alert notifications. With normal settings, this could give you a lot of alerts, so if you only want alerts to fire when abnormal conditions are being met, try setting up a second screener on your chart that has very high threshold values and only has the most important level touches on. Then turn the setting "Do Not Show The Screener On The Chart" to off so the calculations will still run and fire alerts, but won't clog up your charts. This way you can only get alert notifications when major events happen but still have your normal screener settings available on your chart.
Markets This Can Be Used On
This screener uses the price action and volume data so you can use it to scan any type of market you would like as long as the ticker you are scanning has price and volume data feeds. If a market does not have volume data, then it will just show NaN in the volume row and the VWAP rows will not show anything.

Universal Breakout Strategy [KedArc Quant]Description:
A flexible breakout framework where you can test different logics (Prev Day, Bollinger, Volume, ATR, EMA Trend, RSI Confirm, Candle Confirm, Time Filter) under one system.
Choose your breakout mode, and the strategy will handle entries, exits, and optional risk management (ATR stops, take-profits, daily loss guard, cooldowns).
An on-chart info table shows live mode values (like Prev High/Low, Bollinger levels, RSI, etc.) plus P&L stats for quick analysis.
Use it to compare which breakout style works best on your instrument and timeframe, whether intraday, swing, or positional trading
🔑 Why it’s useful
* Flexibility: Switch between breakout strategies without loading different indicators.
* Clarity: On-chart info table displays current mode, relevant indicator levels, and live strategy P&L stats.
* Testing efficiency: Quickly A/B test different breakout styles under the same backtest environment.
* Transparency: Every trade is rule-based and displayed with entry/exit markers.
🚀 How it helps traders
* Lets you experiment with breakout strategies quickly without loading multiple scripts.
* Helps identify which breakout method fits your instrument & timeframe.
* Gives clear on-chart visual + statistical feedback for confident decision-making.
⚙️ Input Configuration
* Breakout Mode → choose which strategy to test:
* *Prev Day* → breakouts of yesterday’s High/Low.
* *Bollinger* → Upper/Lower BB pierce.
* *Volume* → Breakout confirmed with volume above average.
* *ATR Stop* → Wide range breakout using ATR filter.
* *Time Filter* → Breakouts inside defined session hours.
* *EMA Trend* → Breakouts only in EMA fast > slow alignment.
* *RSI Confirm* → Breakouts with RSI confirmation (e.g. >55 for longs).
* *Candle Confirm* → Breakouts validated by bullish/bearish candle.
* Lookback / ATR / Bollinger inputs → adjust sensitivity.
* Intrabar mode → option to evaluate breakouts using bar highs/lows instead of closes.
* Table options → show/hide info table, show/hide P&L stats, choose corner placement.
📈 Entry & Exit Logic
* Entry → occurs when breakout condition of chosen mode is met.
* Exit → default exits via opposite signals or optional stop/target if enabled.
* Session filter → optional auto-flat at session end.
* P&L management → optional daily loss guard, cooldown between trades, and ATR-based stop/take profit.
❓ FAQ — Choosing the best setup
Q: Which strategy should I use for which chart?
* *Prev Day Breakouts*: Best on indices, FX, and liquid futures with strong daily levels.
* *Bollinger*: Works well in range-bound environments, or crypto pairs with volatility compression.
* *Volume*: Good on equities where breakout strength is tied to volume spikes.
* *ATR Stop*: Suits volatile instruments (commodities, crypto).
* *EMA Trend*: Useful in trending markets (stocks, indices).
* *RSI Confirm*: Adds momentum filter, better for swing trades.
* *Candle Confirm*: Ideal for scalpers needing visual confirmation.
* *Time Filter*: For intraday traders who want signals only in high-liquidity sessions.
Q: What timeframe should I use?
* Intraday traders → 5m to 15m (Time Filter, Candle Confirm).
* Swing traders → 1H to 4H (EMA Trend, RSI Confirm, ATR Stop).
* Position traders → Daily (Prev Day, Bollinger).
* Breakout
A trade entry condition triggered when price crosses above a resistance level (for longs) or below a support level (for shorts).
* Prev Day High/Low
Formula:
Prev High = High of (Day )
Prev Low = Low of (Day )
* Bollinger Bands
Formula:
Basis = SMA(Close, Length)
Upper Band = Basis + (Multiplier × StdDev(Close, Length))
Lower Band = Basis – (Multiplier × StdDev(Close, Length))
* Volume Confirmation
A breakout is only valid if:
Volume > SMA(Volume, Length)
* ATR (Average True Range)
Measures volatility.
Formula:
ATR = SMA(True Range, Length)
where True Range = max(High–Low, |High–Close |, |Low–Close |)
* EMA (Exponential Moving Average)
Weighted moving average giving more weight to recent prices.
Formula:
EMA = (Price × α) + (EMA × (1–α))
with α = 2 / (Length + 1)
* RSI (Relative Strength Index)
Momentum oscillator scaled 0–100.
Formula:
RSI = 100 – (100 / (1 + RS))
where RS = Avg(Gain, Length) ÷ Avg(Loss, Length)
* Candle Confirmation
Bullish candle: Close > Open AND Close > Close
Bearish candle: Close < Open AND Close < Close
Win Rate (%)
Formula:
Win Rate = (Winning Trades ÷ Total Trades) × 100
* Average Trade P&L
Formula:
Avg Trade = Net Profit ÷ Total Trades
📊 Performance Notes
The Universal Breakout Strategy is designed as a framework rather than a single-asset optimized system. Results will vary depending on the chart, timeframe, and asset chosen.
On the current defaults (15-minute, INR-denominated example), the backtest produced 132 trades over the selected period. This provides a statistically sufficient sample size.
Win rate (~35%) is relatively low, but this is balanced by a positive reward-to-risk ratio (~1.8). In practice, a lower win rate with larger wins versus smaller losses is sustainable.
The average P&L per trade is close to breakeven under default settings. This is expected, as the strategy is not tuned for a single symbol but offered as a universal breakout framework.
Commissions (0.1%) and slippage (1 tick) are included in the simulation, ensuring realistic conditions.
Risk management is conservative, with order sizing set at 1 unit per trade. This avoids over-leveraging and keeps exposure well under the 5-10% equity risk guideline.
👉 Traders are encouraged to:
Experiment with inputs such as ATR period, breakout length, or Bollinger parameters.
Test across different timeframes and instruments (equities, futures, forex, crypto) to find optimal setups.
Combine with filters (trend direction, volatility regimes, or volume conditions) for further refinement.
⚠️ Disclaimer This script is provided for educational purposes only.
Past performance does not guarantee future results.
Trading involves risk, and users should exercise caution and use proper risk management when applying this strategy.

Dynamic Volume Trace Profile [ChartPrime]⯁ OVERVIEW
Dynamic Volume Trace Profile is a reimagined take on volume profile analysis. Instead of plotting a static horizontal histogram on the side of your chart, this indicator projects dynamic volume trace lines directly onto the price action. Each bin is color-graded according to its relative strength, creating a living “volume skeleton” of the market. The orange trace highlights the current Point of Control (POC)—the price level with maximum historical traded volume within the lookback window. On the right side, the tool builds a mini profile, showing absolute volume per bin alongside its percentage share, where the POC always represents 100% strength .
⯁ KEY FEATURES
Dynamic On-Chart Bins:
The range between highest high and lowest low is split into 25 bins. Each bin is drawn as a horizontal trace line across the lookback chart period.
Gradient Color Encoding:
Trace lines fade from transparent to teal depending on relative volume size. The more intense the teal, the stronger the historical traded activity at that level.
Automatic POC Highlight:
The bin with the highest aggregated volume is flagged with an orange line . This POC adapts bar-by-bar as volume distribution shifts.
Right-Side Volume Profile:
At the chart’s right edge, the script prints a box-style profile. Each bin shows:
• Total volume (absolute units).
• Percentage of max volume, in parentheses (POC bin = 100%).
This gives both raw and normalized context at a glance.
Adjustable Lookback Window:
The lookback defines how many bars feed the profile. Increase for stable HTF zones or decrease for responsive intraday distributions.
POC Toggle & Styling:
Optionally toggle POC highlighting on/off, adjust colors, and set line thickness for better integration with your chart theme.
⯁ HOW IT WORKS (UNDER THE HOOD)
Step Sizing:
over last 100 bars is divided by to calculate bin height.
Volume Aggregation:
For each bar in the , the script checks which bin the close falls into, then adds that bar’s volume to the bin’s counter.
Gradient Mapping:
Bin volume is normalized against the max volume across all bins. That value is mapped onto a gradient from transparent → teal.
POC Logic:
The bin with highest volume is colored orange both on the dynamic trace and in the right-side profile.
Right-Hand Profile:
Boxes are drawn for each bin proportional to volume / maxVolume × 50 units, with text labels showing both absolute volume and normalized %.
⯁ USAGE
Use the orange trace as the dominant “magnet” level—price often gravitates to the POC.
Watch for clusters of strong teal traces as areas of high acceptance; thin or faint zones mark low-liquidity gaps prone to fast moves.
On intraday charts, tighten lookback to reveal session-based distributions . For swing or position trading, expand lookback to surface more durable volume shelves.
Compare the right-side profile % to judge how “top-heavy” or “bottom-heavy” the current distribution is.
Use bright, intense color traces as context for confluence with structure, OBs, or liquidity hunts.
⯁ CONCLUSION
Dynamic Volume Trace Profile takes the traditional volume profile and fuses it into the body of price itself. Instead of a fixed sidebar, you see gradient traces layered directly on the chart, giving real-time context of where volume concentrated and where price may be drawn. With built-in POC highlighting, normalized % readouts, and an adaptive right-side profile, it offers both precision levels and market structure awareness in a cleaner, more intuitive form.

RSI: alternative derivationMost traders accept the Relative Strength Index (RSI) as a standard tool for measuring momentum. But what if RSI is actually a position indicator?
This script introduces an alternative derivation of RSI, offering a fresh perspective on its true nature. Instead of relying on the traditional calculation of average gains and losses, this approach directly considers the price's position relative to its equilibrium (moving average), adjusted for volatility.
While the final value remains identical to the standard RSI, this alternative derivation offers a completely new understanding of the indicator.
Key components:
Price (Close)
Utilizes the closing price, consistent with the original RSI formula.
normalization factor
Transforms raw calculations into a fixed range between -1 and +1.
normalization_factor = 1 / (Length - 1)
EMA of Price
Applies Wilder’s Exponential Moving Average (EMA) to the price, serving as the anchor point for measuring price position, similar to the traditional RSI formula.
myEMA = ta.rma(close,Length)
EMA of close-to-close absolute changes (unit of volatility)
Adjusts for market differences by applying a Wilder’s EMA to absolute price changes (volatility), ensuring consistency across various assets.
CC_vol = ta.rma(math.abs(close - close ),Length)
Calculation Breakdown
DISTANCE:
Calculate the difference between the closing price and its Wilder's EMA. A positive value indicates the price is above the EMA; a negative value indicates it is below.
distance = close - myEMA
STANDARDIZED DISTANCE
Divide the distance by the unit of volatility to standardize the measurement across different markets.
S_distance = distance / CC_vol
NORMALIZED DISTANCE
Normalize the standardized distance using the normalization factor (n-1) to adjust for the lookback period.
N_distance = S_distance * normalization_factor
RSI
Finally, scale the normalized distance to fit within the standard RSI range of 0 to 100.
myRSI = 50 * (1 + N_distance)
The final equation:
RSI = 50 ×
What This Means for RSI
Same RSI Values, Different Interpretation
The standard RSI formula may obscure its true measurement, whereas this approach offers clarity.
RSI primarily indicates the price's position relative to its equilibrium, rather than directly measuring momentum.
RSI can still be used to analyze momentum, but in a more intuitive and well-informed way.

Relative Sector Index Benchmarking by QuantxQuantX Relative Strength helps traders identify whether a stock is outperforming or underperforming NIFTY. It uses a clean histogram with background highlights and a trend line to spot market leaders, laggards, and strength reversals quickly.
